Summing Up the Year That Was
The events of last year seem so long ago now. With the first month of 2014 coming to an end, I thought I would backtrack a bit in today’s Daily Pfennig® edition and look at a very eventful 2013 and how we got to this point, as well as what the rest of the year may have in store for precious metals.
The first trading day of 2013 started off with gold opening at $1,681.50/oz. in London, after posting a nearly 7% return the previous year. In fact, prior to that, gold had not finished with a negative gain since 2000, when it traded under $300 an ounce. From 2001 through 2012, the gold price appreciated almost 515% in that time. So, with over a decade of positive returns and a last minute compromise on the fiscal cliff negotiations, investors were fairly optimistic heading into the New Year. This optimism would be short-lived, however, as we would all find out shortly thereafter.
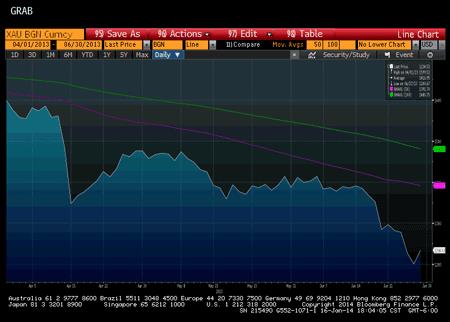
1st Quarter January-March: Up And Down Ride For Gold
Germany requested the repatriation of their gold from the Federal Reserve in New York as well as the Bank of France. The Fed agreed to send the gold back to Germany…in seven years! This led many to believe that the NY Fed did not actually have the gold, and would need that time to repurchase the gold to send it out. India would raise their gold import tax from 2% to 6%, which curbed demand from one of the largest consumers of gold in the world. The rest of January would prove to be uneventful, other than gold reaching what would become the high for the year on 1/22/13 at a price of $1,692/oz.
Metals, in general, trended downward in February, yet demand for physical bullion remained robust. The U.S. Mint and the Royal Canadian Mint were on allocation for silver coins, which meant that they restricted the amount of coins they offered to their distributors. This is now becoming common practice at the beginning of the year, as we are seeing currently in 2014.
Demand up, Supply down…price down? Counter-intuitive, but this would become a theme with precious metals going forward. This would mark the 5th consecutive month of losses for gold, as it dipped below the psychological level of $1,600/oz. March saw the Dow trade higher in 10 consecutive sessions, which was the longest such streak since 1996, as well as bearish 2013 forecasts for gold from such names as Barclays, Credit Suisse, and Goldman Sachs. These pushed gold lower initially, as investors moved over to equities as the market was catching fire. This would also be short-lived, as the insolvency crisis in Cyprus came to the forefront, and gold caught some bids as a safe haven asset, rallying back over the $1,600/oz. mark.

* XAU – symbol for one (1) Troy ounce of gold.
** BGN – Bloomberg generic pricing, or a composite price of dealers that feed in to the system, as opposed to a specific dealer’s pricing.
Source: Bloomberg
2nd Quarter April-June: Taper Becomes The Talk Of The Town
This is where things really started to get interesting. The beginning of April had most investors feeling pretty good about their safe haven hedge, what with the Cyprus fiasco and North Korea making headlines with its nuclear program. This would come to a grinding halt in the middle of the month as gold would go on to lose nearly $220, or 15%, in a matter of two days. Silver would also get dragged down and lose 18% over that period as well.
With blood in the streets, investors were looking for some sort of an explanation, but were left to speculate that this was a coordinated manipulation effort to take the price down. The rest of the month saw gold claw back upwards, and regain about half of what it lost during that price takedown, but needless to say, this was not a good month if you were a holder of precious metals. Prices in May were very choppy, with overall downside pressure, and gold shedding off another $70/oz. from the start of the month. Bernanke made a statement that the Fed may taper their QE program, which resulted in gold selling off dramatically.
The word “taper” would now be engrained in investors’ minds going forward, and would play a major role in price action in later months. June started off fairly slowly as the summer doldrums set in, but after the Federal Open Market Committee (FOMC) meeting on 6/19, Fed Chairman Ben Bernanke once again hinted at upcoming tapering, which sent risk assets into yet another freefall. June would see gold fall over $200/oz. since the beginning of the month, and would mark the end of the worst quarter for the shiny metal since 1920.
* XAU – symbol for one (1) Troy ounce of gold.
** BGN – Bloomberg generic pricing, or a composite price of dealers that feed in to the system, as opposed to a specific dealer’s pricing.
Source: Bloomberg
3rd Quarter July-September: Gold Continues To Mystify
After briefly touching $1,200/oz. in June, gold rallied in July, adding about $100/oz. to the price to finish the month around $1,325/oz. Detroit declaring bankruptcy and oil’s rise in price both contributed to gold’s rally. This month would also see Mr. Bernanke state that nobody understood gold prices, including himself. With light volume and equities backing off a bit, gold had an impressive rally in August of another $100/oz., but eventually would settle in for an $85 increase since the beginning of the month. This month also opened the discussion of a possible war in Syria, which was bullish for gold. The “Septaper” never materialized, and there were positive developments in Syria, so the risk assets sold off, but in a more normal range than the violent swings we saw earlier in the year. Gold would go on to lose $60/oz. since the beginning of the month, in what had historically been a very bullish month for precious metals.
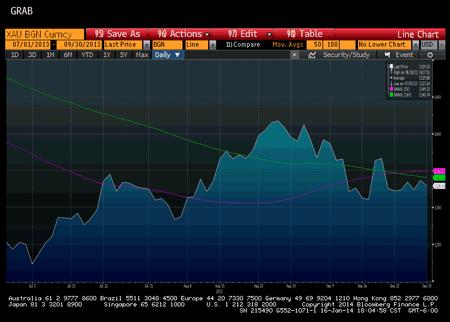
* XAU – symbol for one (1) Troy ounce of gold.
** BGN – Bloomberg generic pricing, or a composite price of dealers that feed in to the system, as opposed to a specific dealer’s pricing.
Source: Bloomberg
Of course, the converse is equally true that these bonds will benefit from a falling interest rate environment and, further, that these fixed income investments provide a critical non-correlated return component to diversified portfolios that helps to reduce portfolio volatility during periods of market turmoil.
4th Quarter October-December: Time To Put 2013 Behind Us
Can you say government shutdown? Conventional thinking was that gold would rally in the face of the shutdown, but that never materialized, and there was worry amongst investors that if gold could not gain support during the shutdown, it would see more selling pressure when the government did finally resume operations. Of course, conventional thinking is almost exactly opposite of how markets react these days, so as soon as the shutdown ended, gold rallied through the end of the month and would tack on an additional $40 since the beginning of the month. November would see employment figures beat estimates by a long margin as well as confirmation from the Fed on QE tapering, which would ultimately drag gold lower throughout the month, ending with a $60 drop overall since the beginning of the month.
And finally, in December, with much of the world celebrating the holidays, there wasn’t much positive news for gold. The Fed announced it would reduce its bond purchases by $10 billion a month, and this would contribute to gold reaching its low of the year on 12/19 at a price of $1,188/oz. Gold would rally just a bit ahead of the new year, but would ultimately post a very bad year overall with a 28% loss. Silver would end with a 35% loss, platinum an 11% loss, and palladium would actually be the only winner, posting a modest gain of almost 2% on the year.
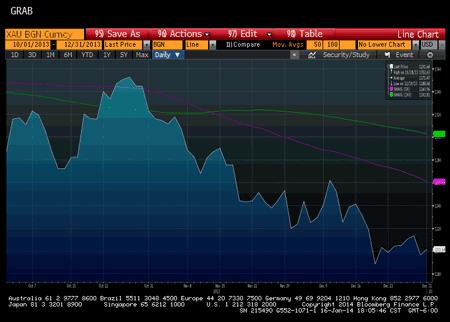
* XAU – symbol for one (1) Troy ounce of gold.
** BGN – Bloomberg generic pricing, or a composite price of dealers that feed in to the system, as opposed to a specific dealer’s pricing.
Source: Bloomberg
Obviously, this was a trying time for holders of precious metals, and it would definitely test our faith. The general theme throughout the year that one could point to for an explanation would be a massive sell-off, which would see over 17 million ounces flow back into the market. Much of this was bought up by central banks around the world, and much of it going to Asia.
Of course, another major contributing factor in all of this is the record levels the equity markets reached this year, which makes it difficult for metals to attract bids, as investors chased returns in the stock market and, thus, created a negative correlation in equities and metals.
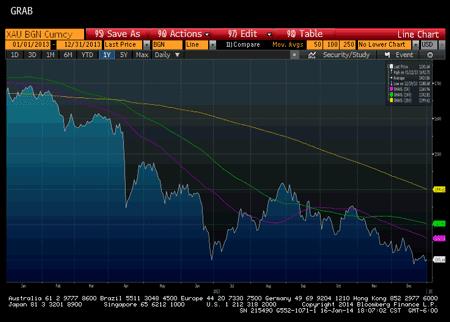
* XAU – symbol for one (1) Troy ounce of gold.
** BGN – Bloomberg generic pricing, or a composite price of dealers that feed in to the system, as opposed to a specific dealer’s pricing.
Source: Bloomberg
It appears that in this coming year metal prices will be largely dictated by interest rates and whether the stock market can sustain its lofty levels, or succumb to the correction that many people have been waiting for. Anyone that purchases metals at current levels could be happy they did so, as we could see an overall increase in metal prices this coming year.
On a side note, I would also like to remind all of you about our non-FDIC insured Metals Select® Automatic Purchase Plan.1 This is an account with EverBank that will allow you to make automated monthly purchases in gold, silver, and/or platinum for as little as $100 per month. This product enables you to diversify your holdings into precious metals with minimal cost, and will allow you to dollar cost average your purchases. The way that 2013 transpired really drives home the point of dollar cost averaging. If someone had invested in gold at the beginning of last year, his or her cost basis would have been $1,681.50/oz. With regular purchases on the 1st of every month, they could have lowered their cost basis to $1,435.29/oz.
To learn more about this program or any of our other metals products, please contact our trade desk at 1.800.926.4922.
Here’s to a happy, healthy, and prosperous 2014 to all of our Daily Pfennig readers!
Until the next Daily Pfennig® edition…
Sincerely,
Tim Smith
Assistant Vice President
EverBank World Markets, a division of EverBank
1.800.926.4922